

Image Details
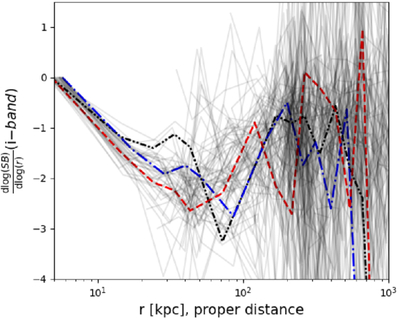
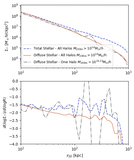
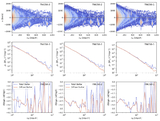
Caption: Figure 3.
Slope profiles of individual redMaPPer clusters. The profiles of three clusters are highlighted in this figure to demonstrate the trends of individual clusters. While the CG slope rapidly steepens (more negative) at larger radius within the first 30 kpc, the profiles become very noisy afterwards. It is much more difficult to identify the dip in the individual profile measurements.
Other Images in This Article
Copyright and Terms & Conditions
© 2026. The Author(s). Published by the American Astronomical Society.

Copyright ©
2026 Astronomy Image Explorer. All Rights Reserved.
