

Image Details
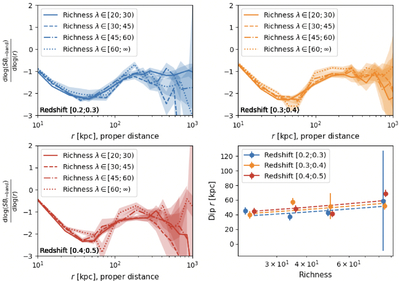
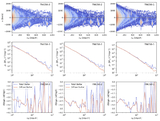
Caption: Figure 2.
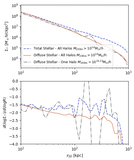
Upper left, upper right, and lower left panels: slope profiles of redMaPPer clusters in different redshift and richness bins. The dip features are present in all cluster subsets. Lower right panel: the local minima of the dips in different redshift and richness subsets. We detect a richness dependence in the minimum radii, but no significant redshift evolution. The dashed lines show the fitted linear relations between the minimum radii and cluster richness at their median redshifts.
Other Images in This Article
Copyright and Terms & Conditions
© 2026. The Author(s). Published by the American Astronomical Society.

Copyright ©
2026 Astronomy Image Explorer. All Rights Reserved.
