Image Details
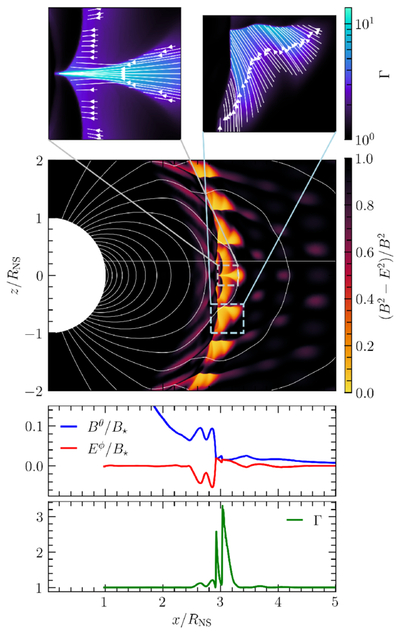
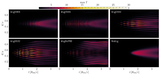
Caption: Figure 8.
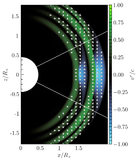
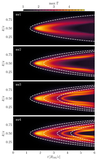
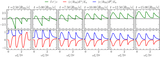
Visualizations of simulation Wig0532 with a perturbed background at t = 2.5RNS/c, showing fragmentation of the shock front due to the presence of large-amplitude standing waves in the magnetosphere. Top: 2D visualizations of the Lorentz factor Γ, zoomed in on regions where the shock has formed in the middle plot. White lines show the flow stream lines upstream of the shock (in zones with sufficiently large four-velocities). Middle: 2D visualization of (B2 − E2)/B2; regions approaching zero indicate the formation of a monster shock. Solid white lines show contours of poloidal magnetic flux, with linear spacing. Bottom two rows show 1D profiles of a double-shock structure forming at z/RNS = 0.25: the electromagnetic field components Bθ and Eϕ, and the Lorentz factor Γ.
Other Images in This Article
Show More
Copyright and Terms & Conditions
© 2026. The Author(s). Published by the American Astronomical Society.