Image Details
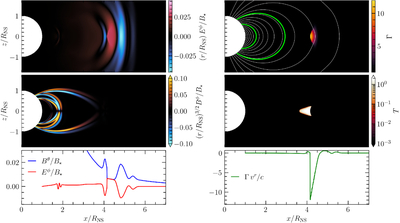
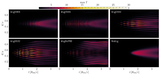
Caption: Figure 7.
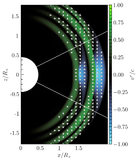
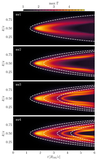
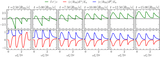
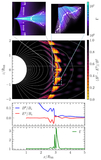
Visualizations of A → FMS mode conversion simulation AW032pi at t = 5.0 [RNS/c]. Top two rows are 2D visualizations of the toroidal ideal electric field Eϕ, indicating the FMS wave (top left); the toroidal magnetic field Bϕ, indicating the A waves (middle left); the Lorentz factor Γ (top right); and the fluid temperature T (middle right). Contours of poloidal magnetic flux are plotted as white solid lines; the contours are linearly spaced. Green contours are drawn showing the magnetic field lines anchored at the edge of the twist. Bottom row shows 1D profiles of a monster shock forming on the equator (z/RNS = 0). The electromagnetic field components Bθ and Eϕ of the generated FMS wave are shown on the left, and the radial four-velocity on the right.
Other Images in This Article
Show More
Copyright and Terms & Conditions
© 2026. The Author(s). Published by the American Astronomical Society.