Image Details
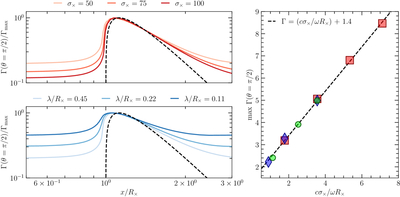
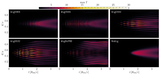
Caption: Figure 2.
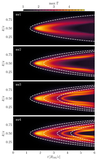
Comparison of the equatorial monster shock to analytic predictions (B23). Left: the upstream Lorentz factor of the monster shock on the equator as a function of cylindrical radius, plotted for multiple values of σ× and λ = 2πc/ω. The black dashed line is the expected analytical scaling (Equation (12)). Right: the maximum Lorentz factor of the equatorial monster shock as a function cσ×/ωR×. The wave amplitude Ew (green circles), wave frequency ω (blue diamonds), and magnetization σ× (red squares) are varied. The black dashed line is a linear function with slope set by the analytical expectation (Equation (11)) and a fitted nonzero y-intercept. Details of the spherical FMS wave simulations can be found in Table 1. All values are taken on the equator, z/R× = 0. Individual linear fits where a single parameter is varied are presented in Appendix D, showing excellent agreement with the analytical expectation.
Other Images in This Article
Show More
Copyright and Terms & Conditions
© 2026. The Author(s). Published by the American Astronomical Society.