Image Details
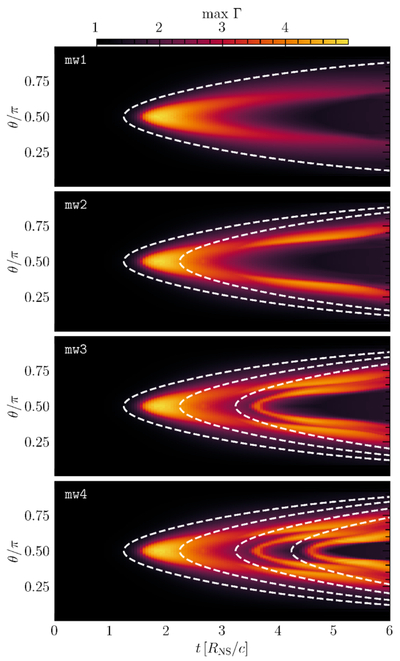
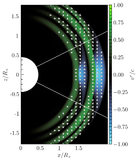
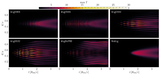
Caption: Figure 5.
The maximum E × B Lorentz factor, as a function of time and polar angle, for the spherical FMS wave simulations listed in Table 1; these vary the number of FMS wavelengths launched from one to four. The Lorentz factor in the secondary shock fronts is seen to peak off the equator. The analytical expectation for the nonlinearity radius, r×(θ) (Equation (14)), is plotted as a dashed white line for each wavelength, assuming propagation at the speed of light.
Other Images in This Article
Show More
Copyright and Terms & Conditions
© 2026. The Author(s). Published by the American Astronomical Society.
Copyright ©
2026 Astronomy Image Explorer. All Rights Reserved.