Image Details
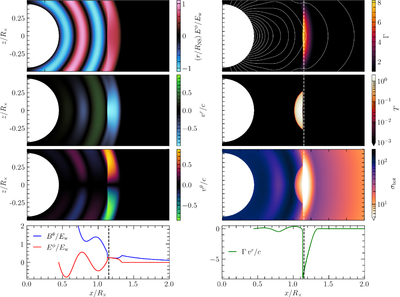
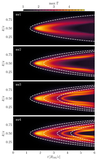
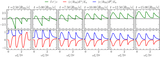
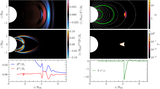
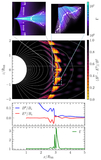
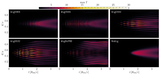
Caption: Figure 3.
Visualizations of spherical FMS wave simulation sigma100 at t = 2RNS/c. Top three rows are two-dimensional (2D) visualizations of the toroidal ideal electric field Eϕ (top left), the radial E × B velocity vr (middle left), the angular velocity vθ (bottom left), the Lorentz factor Γ (top right), the fluid temperature T (middle right), and the magnetization accounting for the fluid temperature σhot (bottom right). Contours of poloidal magnetic flux are plotted as white solid lines; the contours are linearly spaced. A white (black) vertical dashed line is placed at x = 1.15R×. Bottom row shows 1D equatorial slices (z/R× = 0) of the FMS electromagnetic wave components Bθ and Eϕ (left), and the radial four-velocity (right).
Other Images in This Article
Show More
Copyright and Terms & Conditions
© 2026. The Author(s). Published by the American Astronomical Society.