Image Details
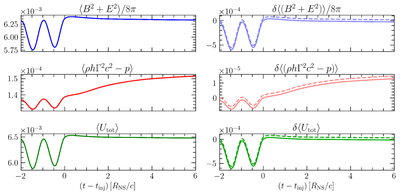
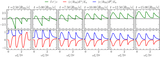
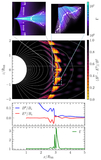
Caption: Figure 13.
The time dependence of area-averaged quantities over the entire domain for simulation sigma100. Top row: the total and change in electromagnetic energy. Middle row: the total and change in thermal and kinetic energy in the plasma. Bottom row: the total and change in total energy. For all plots in the right column, the solid line shows the change from the quantity at time tinj, where the wave has finished injection from the boundary, and the dashed line shows the change from the quantity at t = 0.
Other Images in This Article
Show More
Copyright and Terms & Conditions
© 2026. The Author(s). Published by the American Astronomical Society.
Copyright ©
2026 Astronomy Image Explorer. All Rights Reserved.