Image Details
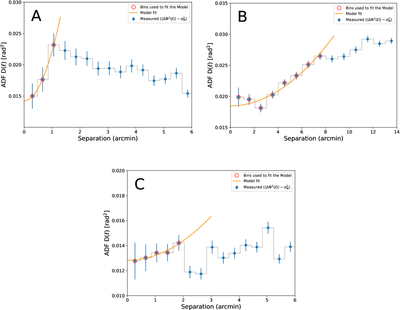
Caption: Figure 12.
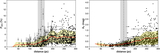
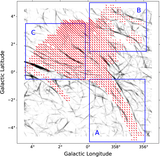
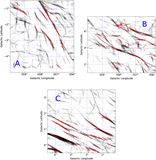
Measured angular dispersion function, ﹩({\rm{\Delta }}{{\rm{\Phi }}}^{2}(\ell )-{\sigma }_{{\rm{M}}}^{2})﹩, as a function of angular separation ℓ for the three regions defined in Figure 8 (Fields A, B, and C). Blue points show the measured ADF, with vertical bars indicating statistical uncertainties. Orange curves represent the best-fitting ADF models, and red symbols mark the bins used in the fits. Fields A and C are characterized by relatively ordered magnetic fields, but they differ in field strength and internal complexity. On the other hand, Field B is dominated by a higher level of disorder and large-scale variations. The zero-separation intercept of the fitted models yields the turbulent angular dispersion parameter, b, used to estimate the plane-of-sky magnetic-field strength. At the estimated distance to the R–C cloud, 1′ corresponds to ∼0.04 pc.
Other Images in This Article
Show More
Copyright and Terms & Conditions
© 2026. The Author(s). Published by the American Astronomical Society.