Image Details
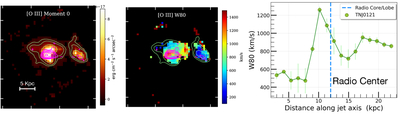
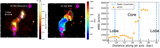
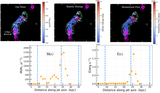
Caption: Figure 17.
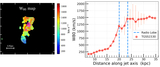
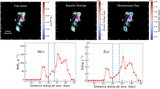
Spatially resolved [O III]λ5007 emission in TN J0121. Left: [O III] moment 0 map the clumpy and asymmetric ionized gas distribution, with the brightest emission concentrated near the radio core (magenta contour lines) and a secondary, spatially offset clump lying ∼2″ to the east. Middle: [O III] W80 map tracing the velocity width of the [O III] line, which peaks in the vicinity of the radio center and shows localized broadening (>1200 km s−1) indicative of AGN-driven kinematic disturbance. Right: radial W80 radial profile along the putative jet axis. Similar to the 2D map, the average W80 radial profile also shows relatively modest line width (∼500–800 km s−1) across most regions but exhibits a spike to >1200 km s−1 near the radio core. The compact radio morphology in TN J0121 might host a small-scale jet underneath, which is pushing the gas and disrupting the kinematics.
Other Images in This Article
Show More
Copyright and Terms & Conditions
© 2026. The Author(s). Published by the American Astronomical Society.