Image Details
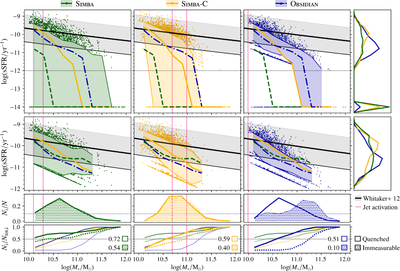
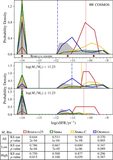
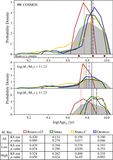
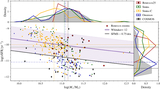
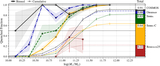
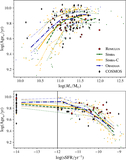
Caption: Figure 9.
Overview of star formation and quenching in SIMBA and its variants for BGGs with ﹩\mathrm{log}({M}_{* }/{M}_{\odot })\in [10,\,12]﹩. From left to right, the first, second, and third columns, respectively, highlight BGGs from the SIMBA (green, dashed lines), SIMBA-C (yellow, solid lines), and OBSIDIAN (blue, dotted–dashed lines) simulations. Top row: the sSFR–M* relation for all sSFRs. The simulations’ median relations are shown in every panel, and each simulation’s respective column shows its 16th and 84th interpercentile range (shaded region) and the systems beyond (data points). The black line and gray shading are the K. E. Whitaker et al. (2012) SFMS and the ±0.75 dex region around it, below which BGGs are considered quenched. The horizontal black dotted line is the measurable sSFR limit ﹩\mathrm{log}({\rm{sSFR}}/{{\rm{yr}}}^{-1})=-12﹩. The rightmost panel in the top row contains the simulations’ sSFR distributions as density histograms. The vertical pink lines give an estimated stellar mass for which jet feedback is activated in each simulation. Middle row: the sSFR–M* relation for BGGs with measurable ﹩\mathrm{log}({\rm{sSFR}}/{{\rm{yr}}}^{-1})\gt -12﹩. The rightmost distributions are normalized with respect to the measurable sSFR sample sizes, and all other formatting follows that in the top row. Bottom row: a comparison between BGG subsamples with quenched (solid lines) and immeasurable ﹩\mathrm{log}({\rm{sSFR}}/{{\rm{yr}}}^{-1})\,\leqslant \,-12﹩ (dotted lines and hatching) sSFRs. The top plot shows the fraction of each sSFR subsample contained within stellar mass bins of width 0.25 dex (Ni/N), and the bottom plot shows the relative fraction of all BGGs in the same mass bins that are immeasurable or quenched (Ni/Ntot,i). The relative fractions of each simulation are on all panels for comparison, and the legends in the lowest panels show the simulations’ total fraction of BGGs in each sSFR subsample.
Other Images in This Article
Copyright and Terms & Conditions
© 2026. The Author(s). Published by the American Astronomical Society.