Image Details
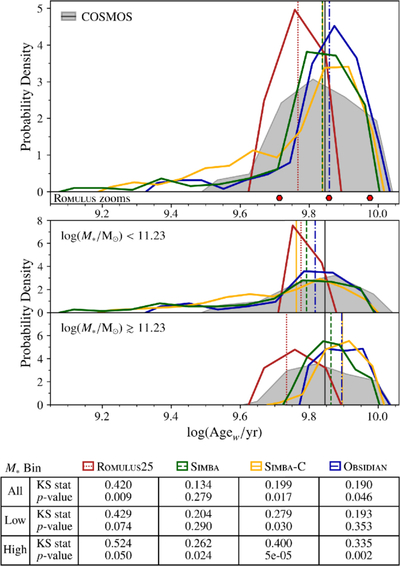
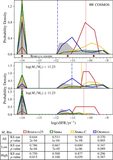
Caption: Figure 5.
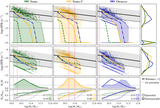
BGG mass-weighted stellar age (Agew) distributions. Formatting follows that of Figure 4. The table contains the results of K-S tests comparing the simulations’ ﹩\mathrm{log}({{\rm{Age}}}_{w}/{\rm{yr}})﹩ distribution to that of COSMOS, where the top, middle, and bottom rows, respectively, compare the full, low-M*, and high-M* samples.
Other Images in This Article
Copyright and Terms & Conditions
© 2026. The Author(s). Published by the American Astronomical Society.
Copyright ©
2026 Astronomy Image Explorer. All Rights Reserved.