Image Details
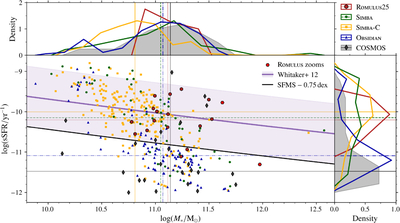
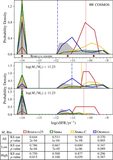
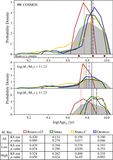
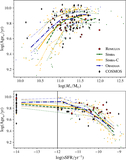
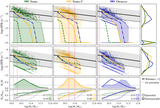
Caption: Figure 6.
sSFR–M* relations for samples of BGGs with ﹩\mathrm{log}({\rm{sSFR}}/{{\rm{yr}}}^{-1})﹩ > −12. The central panel depicts individual BGGs on the sSFR–M* plane with markers following the formatting of Figure 2. The purple line is the K. E. Whitaker et al. (2012) SFMS, with the corresponding shaded band showing the region ±0.75 dex around it. BGGs are considered quenched if they fall under the black line sitting 0.75 dex below the K. E. Whitaker et al. (2012) SFMS. The top and right panels, respectively, show the stellar mass and sSFR distributions for the samples of BGGs with ﹩\mathrm{log}({\rm{sSFR}}/{{\rm{yr}}}^{-1})﹩ > −12, normalized with respect to the measurable sSFR sample sizes and following the same formatting as Figures 3– 5. The samples’ median stellar masses and sSFRs are shown as lines on the distributions and extended onto the central panel. BGGs from the ROMULUS zoom simulations are not included in the ROMULUS25 distributions, but are shown on the sSFR–M* plane as bright-red hexagons.
Other Images in This Article
Copyright and Terms & Conditions
© 2026. The Author(s). Published by the American Astronomical Society.