Image Details
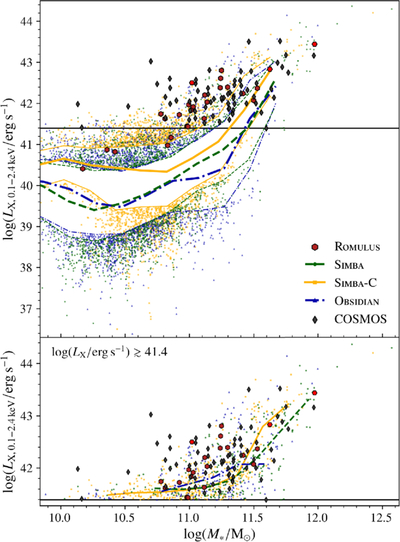
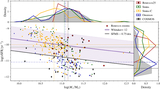
Caption: Figure 2.
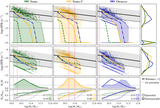
LX–M* relations for observed and simulated BGGs. Top panel: the initial samples of simulated BGGs for all LX. The SIMBA, SIMBA-C, and OBSIDIAN BGGs are represented by median lines, with outer lines and data points showing the 16th and 84th interpercentile regions and outer scatter. The black line illustrates the COSMOS minimum ﹩\mathrm{log}({L}_{{\rm{X}},\,0.1-2.4\,{\rm{keV}}}/{\rm{erg}}\,{{\rm{s}}}^{-1})\simeq 41.4﹩. All other formatting follows that of Figure 1. Bottom panel: the selected samples satisfying ﹩\mathrm{log}({L}_{{\rm{X}}}/{\rm{erg}}\,{{\rm{s}}}^{-1})\gtrsim 41.4﹩. All SIMBA, SIMBA-C, and OBSIDIAN BGGs are shown as data points in addition to their medians.
Other Images in This Article
Copyright and Terms & Conditions
© 2026. The Author(s). Published by the American Astronomical Society.