Image Details
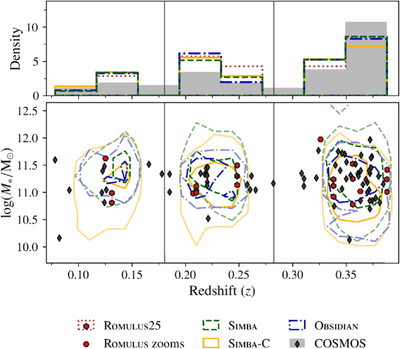
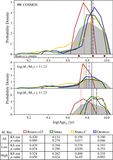
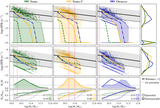
Caption: Figure 1.
Top panels: BGG redshift distributions. Simulated BGGs satisfying ﹩\mathrm{log}({L}_{{\rm{X}},\,0.1-2.4\,{\rm{keV}}}/{\rm{erg}}\,{{\rm{s}}}^{-1})\geqslant 41.4﹩ are selected from nine snapshots to match the redshift distribution of the COSMOS sample (gray shaded histogram). The ROMULUS25 histogram is outlined in dotted red, SIMBA in dashed green, SIMBA-C in solid yellow, and OBSIDIAN in dotted–dashed blue. The vertical black lines mark the boundaries between redshift bins z ∈ [0.08, 0.18), z ∈ [0.18, 0.28), and z ∈ [0.28, 0.38]. Bottom panels: BGG stellar mass as a function of redshift. COSMOS BGGs are shown as gray diamonds, ROMULUS25 BBGs as dark-red hexagons, and BGGs from the ROMULUS zoom simulations as bright-red hexagons. The SIMBA, SIMBA-C, and OBSIDIAN BGGs are represented by 1σ and 3σ 2D histogram contour lines.
Other Images in This Article
Copyright and Terms & Conditions
© 2026. The Author(s). Published by the American Astronomical Society.