Image Details
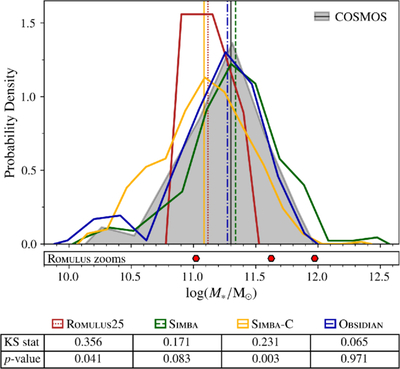
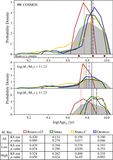
Caption: Figure 3.
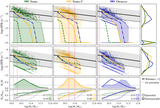
BGG stellar mass distributions illustrated by normalized density histograms. The solid curves and vertical lines of corresponding color are the M* distributions and sample medians, respectively for the simulated BGG samples: ROMULUS25 (red, dotted median), SIMBA (green, dashed–dotted median), SIMBA-C (yellow, solid median), and OBSIDIAN (blue, dashed median). COSMOS is represented by the gray shaded distribution and solid gray median line. BGG stellar masses from the ROMULUS zoom simulations are shown in the bottom panel as bright-red hexagons. The table contains the results of two-sample K-S tests comparing the simulations’ ﹩\mathrm{log}({M}_{* }/{M}_{\odot })﹩ distributions to that of COSMOS.
Other Images in This Article
Copyright and Terms & Conditions
© 2026. The Author(s). Published by the American Astronomical Society.