Image Details
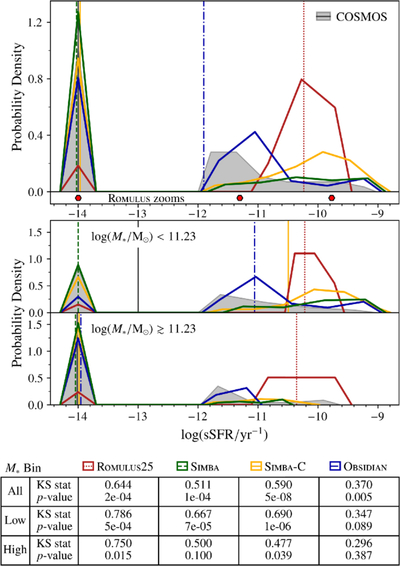
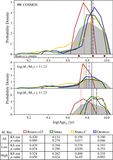
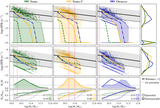
Caption: Figure 4.
BGG sSFR distributions. The top panel depicts the full BGG samples, the middle panel shows BGGs in the low-M* bin with ﹩\mathrm{log}({M}_{* }/{M}_{\odot })﹩ < 11.23, and the bottom panel shows BGGs in the high-M* bin with ﹩\mathrm{log}({M}_{* }/{M}_{\odot })\gtrsim 11.23﹩ (see Table 1). All BGGs with ﹩\mathrm{log}({\rm{sSFR}}/{{\rm{yr}}}^{-1})\,\leqslant \,-12﹩ are set to ﹩\mathrm{log}({\rm{sSFR}}/{{\rm{yr}}}^{-1})﹩ = −14 to account for the minimum detection threshold of sSFR (see the text). All other formatting follows that of Figure 3. The table contains the results of two-sided K-S tests comparing the simulation samples’ distributions of measurable ﹩\mathrm{log}({\rm{sSFR}}/{{\rm{yr}}}^{-1})\gt -12﹩ to that of the COSMOS sample. The top, middle, and bottom rows, respectively, compare ﹩\mathrm{log}({\rm{sSFR}}/{{\rm{yr}}}^{-1})\gt -12﹩ distributions in the full, low-M*, and high-M* samples.
Other Images in This Article
Copyright and Terms & Conditions
© 2026. The Author(s). Published by the American Astronomical Society.