Image Details
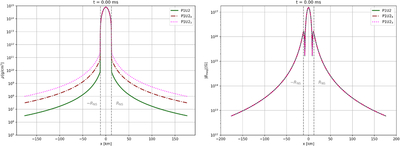
Caption: Figure 12.
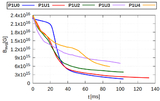
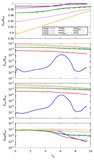
One-dimensional plots at y = z = 0 at different times for models P1U2, P1U23, and P1U24. Left panel: density in log-scale. Gray dashed lines represent the NS initial radius RNS(t = 0). Right panel: magnetic field strength ∣Bmag∣, with the three lines superposed.
Other Images in This Article
Show More
Copyright and Terms & Conditions
© 2026. The Author(s). Published by the American Astronomical Society.
Copyright ©
2026 Astronomy Image Explorer. All Rights Reserved.