Image Details
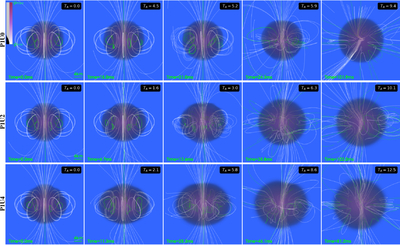
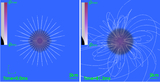
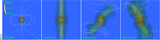
Caption: Figure 1.
Three-dimensional volume rendering of the rest-mass density ρ at selected TA for cases in Table 1 along with the magnetic field lines. Green and white lines display magnetic field lines that are either confined in the stars (green) or extend from the stellar interior into the exterior (white). The color bar (logarithmic scale) ranges from the atmospheric density to the maximum rest-mass density at the corresponding time. The black and gray rectangles to the left of the color bar indicate opacity, which ranges from fully opaque (black) to approximately ∼76% opacity (gray).
Other Images in This Article
Show More
Copyright and Terms & Conditions
© 2026. The Author(s). Published by the American Astronomical Society.
Copyright ©
2026 Astronomy Image Explorer. All Rights Reserved.