Image Details
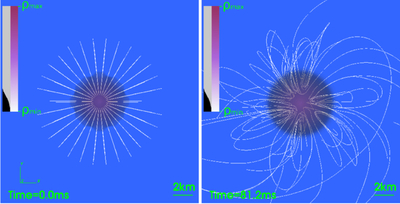
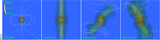
Caption: Figure 6.
Top view of the rest-mass density of P1U4, along with the field lines at TA = 0 (left panel) and near to the end of the simulation (≈12.5TA). The color bar (logarithmic scale) ranges from the atmospheric density to the maximum rest-mass density at the corresponding time. The black and gray rectangles to the left of the color bar indicate opacity, which ranges from fully opaque (black) to ∼76% opacity (gray).
Other Images in This Article
Show More
Copyright and Terms & Conditions
© 2026. The Author(s). Published by the American Astronomical Society.
Copyright ©
2026 Astronomy Image Explorer. All Rights Reserved.