Image Details
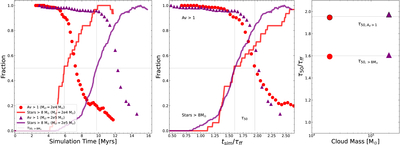
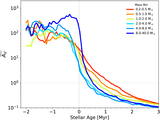
Caption: Figure 9.
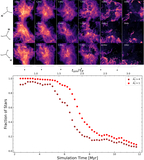
Comparison between two STARFORGE simulations, differing in molecular cloud mass. The fiducial 2 × 10⁴ M⊙ cloud is shown in red, while the 2 × 10⁴ M⊙ cloud is shown in purple. The left panel correspond to Figure 4, with points showing the fraction of stars with ﹩\widetilde{{A}_{{\rm{V}}}}﹩ > 1, while the solid lines show the fraction of stars >8 M⊙, which have begun their protostellar stage. The middle panel shows the same as the left panel, but is normalized by the respective cloud freefall times, τff, demonstrating that the start of emergence is related to initial cloud mass and density. The vertical gray lines correspond to ﹩{\tau }_{50,\gt 8{M}_{\odot }}﹩ and ﹩{\tau }_{50,{A}_{{\rm{V}}}\gt 1}﹩, which denote the time where 50% of the stars >8 M⊙ have begun their protostellar stages, and the time when 50% of the stars have an ﹩\widetilde{{A}_{{\rm{V}}}}﹩ > 1. These metrics are also shown in the right panel. In both simulations, the extinction is tied to the point in the star-forming event where the high-mass stars form.
Other Images in This Article
Show More
Copyright and Terms & Conditions
© 2026. The Author(s). Published by the American Astronomical Society.