Image Details
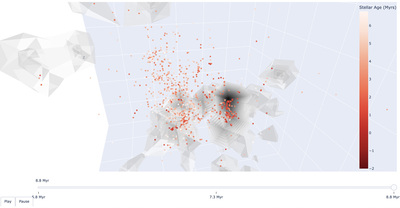
Caption: Figure 2.
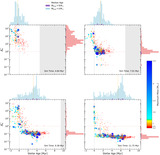
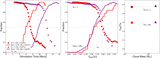
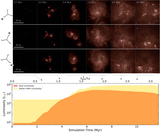
Interactive figure showing stellar and gas locations at three simulation snapshots, mapped to the middle panels of Figure 4. The red scatter points indicate stellar locations, where the points are colored by stellar age as defined in Section 3.1 where negative ages (darker red colors) are stars that are still undergoing accretion. The gray contours depict the gas density at that location. The white lines on the grid mark 5 pc. The still snapshot shown is at 8.8 Myr, and demonstrates that the ongoing star formation is for a localized subclump in the right part of the image. The interactive version of the plot includes 5.8 Myr, as well as 7.3 Myr, where readers can rotate around simulation space and zoom in/out.
An interactive version of this figure is available in the online article.
An interactive version of this figure is available.
An interactive version of this figure is available in the online journal.
Other Images in This Article
Show More
Copyright and Terms & Conditions
© 2026. The Author(s). Published by the American Astronomical Society.