Image Details
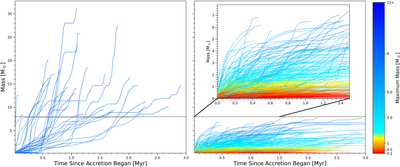
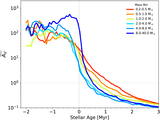
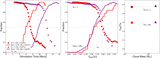
Caption: Figure 5.
Accretion histories for stars in the simulation, colored by their final maximum mass, mapped to Figure 1. Tracks for individual stars are only plotted until the point where the star reaches its maximum mass. The horizontal dashed line at 8 M⊙ represents portions of the evolution considered in the massive star counter. Stars in the left panel are the 31 stars with a final masses >8 M⊙, while all other stars are in the right panel. We show a zoomed-in axis range in the right panel only going to 8 M⊙ on the y-axis, and 0–1.5 Myr on the x-axis.
Other Images in This Article
Show More
Copyright and Terms & Conditions
© 2026. The Author(s). Published by the American Astronomical Society.
Copyright ©
2026 Astronomy Image Explorer. All Rights Reserved.