Image Details
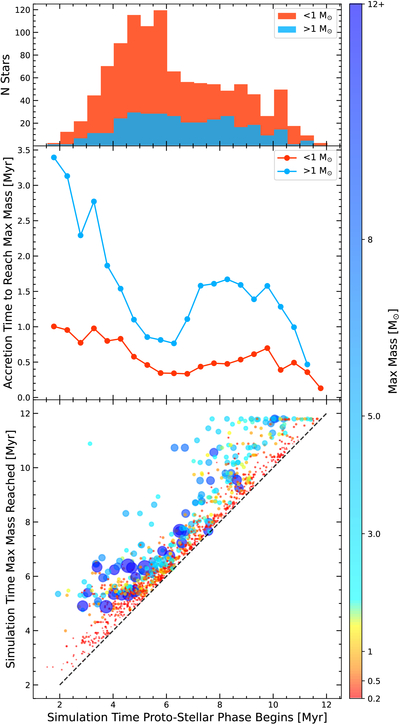
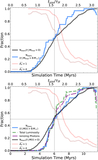
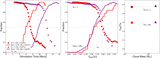
Caption: Figure 1.
Shown here is the simulation time where a sink particle begins to accrete and how long it takes for that particle to reach its maximum mass, which we take to be the zero-point of a star’s age. The top panel shows the distribution of stellar formation times, split into two bins, one for stars below 1 M⊙, and one for stars larger than 1 M⊙. The middle panel then shows the average time it takes for the stars in these two bins to achieve their maximum mass. In both bins, but specifically for the larger stars, the accretion time depends on simulation time, which encodes the gas density. The bottom panel then shows each individual star, colored and sized by its final mass, where the y-axis shows the simulation time where each star reaches its maximum mass. The accretion time is then vertical distance above the dashed one-to-one line.
Other Images in This Article
Show More
Copyright and Terms & Conditions
© 2026. The Author(s). Published by the American Astronomical Society.