Image Details
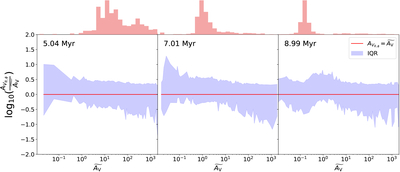
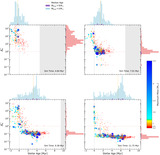
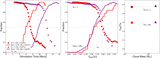
Caption: Figure 3.
Interquartile ranges (IQRs) for the log ratio of stellar AVs at different viewing angles, ﹩{{A}_{{\rm{V}}}}_{\theta ,\phi }﹩, and a function of the median extinction ﹩\widetilde{{A}_{{\rm{V}}}}﹩, shown for three different times in the simulation. Shown in red is the one-to-one line where ﹩{{A}_{{\rm{V}}}}_{\theta ,\phi }﹩ is equal to ﹩\widetilde{{A}_{{\rm{V}}}}﹩, while the blue shaded region shows inner quartile range. The histograms above are the number density of stars at a given ﹩\widetilde{{A}_{{\rm{V}}}}﹩ at that time, showing how many stars are contributing to the IQR.
Other Images in This Article
Show More
Copyright and Terms & Conditions
© 2026. The Author(s). Published by the American Astronomical Society.
Copyright ©
2026 Astronomy Image Explorer. All Rights Reserved.