Image Details
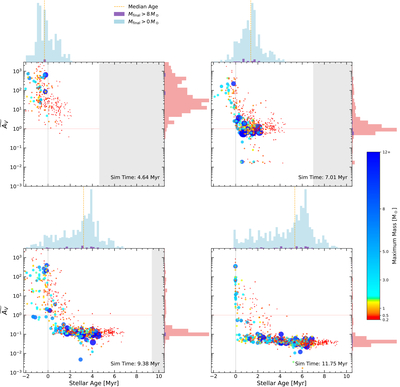
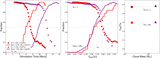
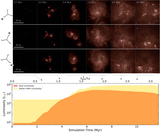
Caption: Figure 7.
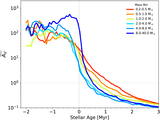
Each star’s extinction as a function of stellar age, for four simulation snapshots. A movie showing each snapshot is available. The extinction is taken to be the median value across all viewing angles, and age zero corresponds to the time the star reaches its maximum mass (Figure 1), which is shown by the dashed vertical line. The horizontal red line at ﹩\widetilde{{A}_{{\rm{V}}}}=1﹩ corresponds to the red points in Figure 4. In each snapshot, the extinction decreased exponentially, with a precipitous decay around the time the star reaching it’s maximum mass. Additionally, the time a star remains heavily embedded appears to depend on stellar mass, where most red points stay above the ﹩\widetilde{{A}_{{\rm{V}}}}=1﹩ line well after their zero age, compared to stars >8 M⊙ that tend to fall below this threshold right around this zero age. We discuss this trend further in Figure 8. The top histograms are number counts for stars of different ages, with blue depicting all stars, and purple representing stars larger than 8 M⊙. The side histograms are the number counts of stars at a given extinction. We see star formation occurring across the entire duration of the simulation, and high-mass stars form throughout. The movie can also be found on Zenodo: DOI: 10.5281/zenodo.17667459.
(An animation of this figure is available in the online article.)
(An animation of this figure is available.)
The video/animation of this figure is available in the online journal.
Other Images in This Article
Show More
Copyright and Terms & Conditions
© 2026. The Author(s). Published by the American Astronomical Society.