Image Details
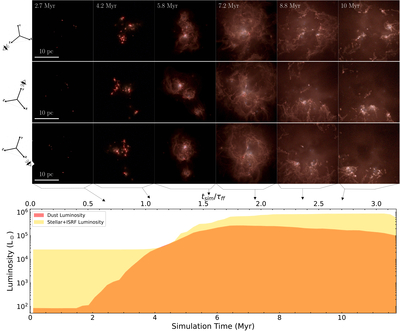
Caption: Figure 10.
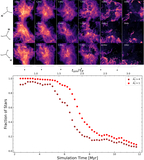
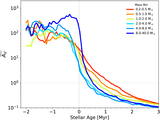
Top panels: three-color (R: 80–120 μm, G: 6–13 μm B: 20–30 μm) composite images of the STARFORGE simulation viewed from three different angles at 500 pc with time increasing left to right. Bottom panel: time evolution of the total dust luminosity in solar lumins (red) compared to the luminosity from stars and the ISRF (yellow). We include a larger, high-resolution image of one viewing angle from the 7.2 Myr snapshot in the Appendix.
Other Images in This Article
Show More
Copyright and Terms & Conditions
© 2026. The Author(s). Published by the American Astronomical Society.
Copyright ©
2026 Astronomy Image Explorer. All Rights Reserved.