Image Details
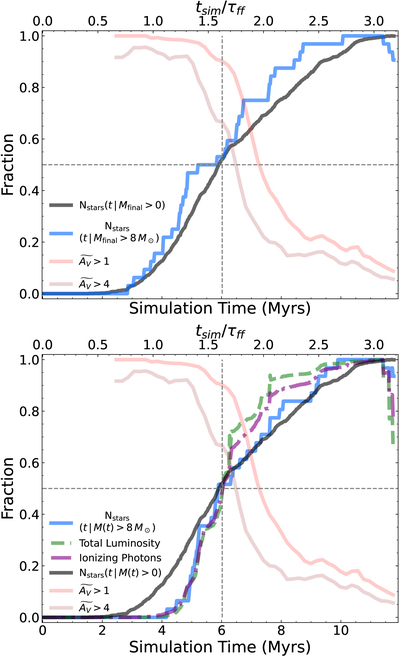
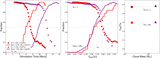
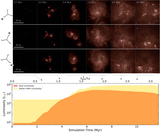
Caption: Figure 6.
Top panel: distributions of the fraction of stars that have formed (black), as well as the fraction of stars larger than 8 M⊙ (blue) that have begun accretion as a function if time. Both fractions are a ratio of the number at the current time step compared to the total amount that formed. Also shown is the fraction of stars with an ﹩\widetilde{{A}_{{\rm{V}}}}﹩ > 1 (transparent red) and >4 (transparent brown) from Figure 4 for comparison to the association embeddedness. In each panel, we show gray dashed lines at 50% and at 6 Myr, the point where ﹩\widetilde{{A}_{{\rm{V}}}}\gt 1﹩ begins to steeply drop. Bottom panel: bolometric stellar luminosity at each time step is shown in the dashed green line, and the number of ionizing photons is shown in dashed–dotted purple line, both normalized by the maximum value at any time. We see the fractional luminosity and the fraction of ionizing photons closely track the number of massive stars that have formed. Noticeably, each of the quantities converges to 50% around the same time.
Other Images in This Article
Show More
Copyright and Terms & Conditions
© 2026. The Author(s). Published by the American Astronomical Society.