Image Details
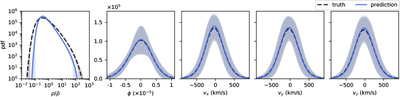
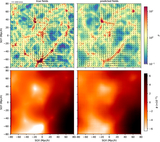
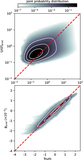
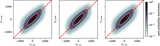
Caption: Figure 8.
PDFs of the true (black dashed lines and transparent bands) and predicted (blue solid lines and transparent bands) fields, from left to right: density field, potential field, and Cartesian components of the 3D peculiar velocity field. The lines and bands represent, respectively, the mean and 1σ standard deviation over all validation samples.
Other Images in This Article
Show More
Copyright and Terms & Conditions
© 2026. The Author(s). Published by the American Astronomical Society.
Copyright ©
2026 Astronomy Image Explorer. All Rights Reserved.