Image Details
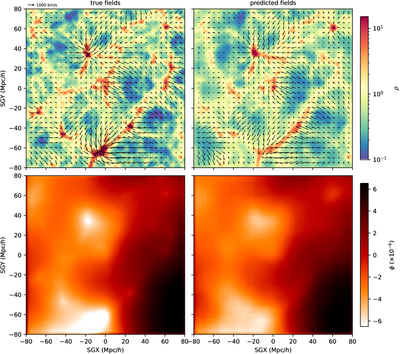
Caption: Figure 7.
Comparison of the dark matter density (top row) and gravitational potential (bottom row) fields. Left panels show the true fields, and right panels show the fields predicted by the CNN model. Predictions are obtained from a single, randomly chosen validation sample. All panels display the same SGX–SGY slice of width −15 < SGZ < 15 Mpc h−1. The true and predicted velocity fields, derived from each respective potential field, are shown on the top of each density field (arrows).
Other Images in This Article
Show More
Copyright and Terms & Conditions
© 2026. The Author(s). Published by the American Astronomical Society.
Copyright ©
2026 Astronomy Image Explorer. All Rights Reserved.