Image Details
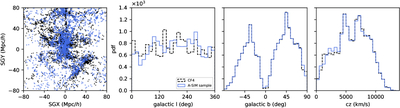
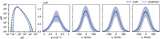
Caption: Figure 1.
Comparison between the CF4 observational data (within the 160 Mpc h−1 box) and a CF4-like mock sample. From left to right: SGX–SGY slice of width −15 < SGZ < 15 Mpc h−1, and distributions of Galactic longitude l, Galactic latitude b, and redshift cz. In each panel, black points and dashed lines represent the CF4 observational data, while blue squares and solid lines correspond to the mock sample.
Other Images in This Article
Show More
Copyright and Terms & Conditions
© 2026. The Author(s). Published by the American Astronomical Society.
Copyright ©
2026 Astronomy Image Explorer. All Rights Reserved.