Image Details
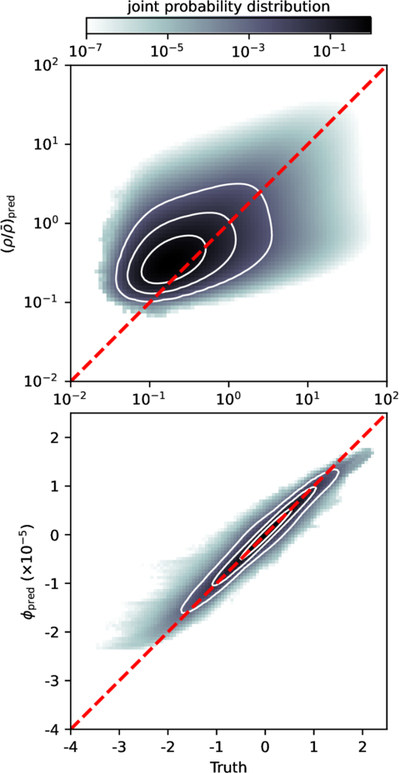
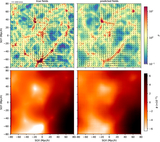
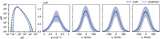
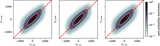
Caption: Figure 9.
Joint probability distribution of the predicted and true values with 1σ, 2σ, and 3σ certainty level contours (white solid lines), derived from all validation samples, for both the density (top) and potential (bottom) fields. The identity line is shown on each panel as a dashed red line for reference. Pearson correlation coefficients between the predicted and true fields are 0.65 ± 0.03 for density, 0.98 ± 0.01 for potential, and although not shown in the figure, 0.83 ± 0.12 for the x-, 0.81 ± 0.14 for the y-, and 0.83 ± 0.12 for the z-components of the velocity field (mean and 1σ standard deviation across all validation samples).
Other Images in This Article
Show More
Copyright and Terms & Conditions
© 2026. The Author(s). Published by the American Astronomical Society.