Image Details
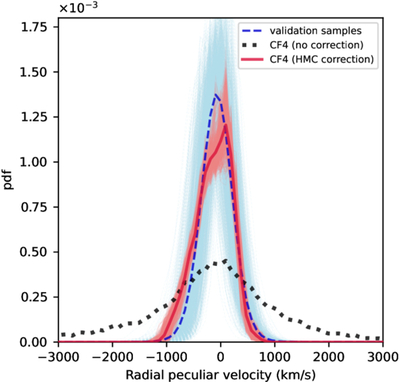
Caption: Figure 3.
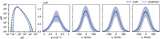
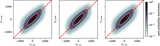
Distribution of radial peculiar velocities. The blue dashed lines represent the A-SIM validation samples, with thin lines showing individual samples and the thicker line indicating the mean distribution. The red solid lines correspond to the CF4 dataset after correction using HMC reconstruction, with thin lines representing individual samples and the thicker line showing the mean. The black dotted line depicts the CF4 distribution before correction.
Other Images in This Article
Show More
Copyright and Terms & Conditions
© 2026. The Author(s). Published by the American Astronomical Society.
Copyright ©
2026 Astronomy Image Explorer. All Rights Reserved.