Image Details
Caption: Figure 15.
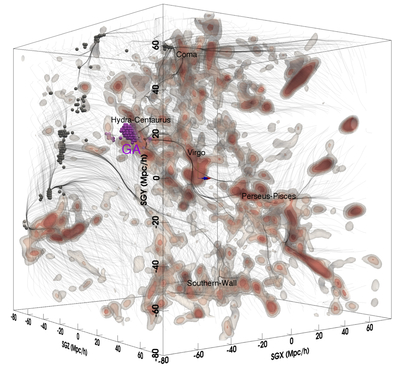
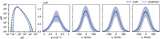
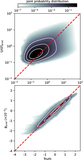
3D visualization of the mean density and peculiar velocity fields in super-Galactic coordinates. The isosurfaces represent the mean density field across 1000 realizations, with three levels highlighting different density thresholds. Streamlines depict the mean peculiar velocity field, also averaged over 1000 realizations. Tiny purple spheres mark the positions of GA candidates. Tiny gray spheres indicate the positions of streamline end points that were not identified as a GA, where the streamlines terminated at the box limits. The orientation and scale of the visualization are shown by the SGX-, SGY-, and SGZ-axes, represented, respectively, by red, green, and blue arrows at the observer’s position (the cube center), each with a length of 10 Mpc h−1. An interactive version of this figure is available in the online article and on Sketchfab at sketchfab.com/3d-models/fig5-085e6af7631a43d38caad75858be4724. It allows users to rotate, zoom, and explore the 3D isosurfaces of the mean density field and the streamlines of the mean peculiar velocity field in super-Galactic coordinates. The coordinate axes and color-coded density thresholds correspond to those shown in the static version.
An interactive version of this figure is available in the online article.
An interactive version of this figure is available.
An interactive version of this figure is available in the online journal.
Other Images in This Article
Show More
Copyright and Terms & Conditions
© 2026. The Author(s). Published by the American Astronomical Society.