Image Details
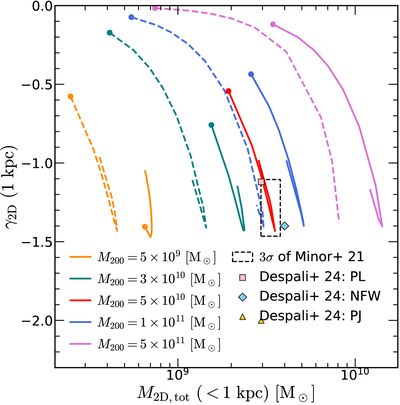
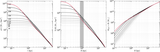
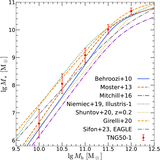
Caption: Figure 9.
Same format as Figure 3: dashed curves show the original evolutionary tracks, while solid curves display the evolution of an SIDM halo with precollapse c200 higher than the median by 3σ (=0.45 dex).
Other Images in This Article
Copyright and Terms & Conditions
© 2025. The Author(s). Published by the American Astronomical Society.
Copyright ©
2026 Astronomy Image Explorer. All Rights Reserved.