Image Details
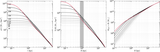
Caption: Figure 5.
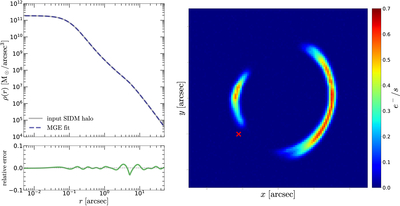
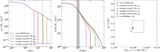
Left: the MGE fitting result for the density profile of the input SIDM halo. The 3D density profile of the perturber is shown as a gray line, while the MGE fitting result is represented by a navy dashed line. The relative error is illustrated in the bottom subplot. Right: the mock lensing image, with the red cross representing the position of the input SIDM halo.
Other Images in This Article
Copyright and Terms & Conditions
© 2025. The Author(s). Published by the American Astronomical Society.
Copyright ©
2026 Astronomy Image Explorer. All Rights Reserved.