Image Details
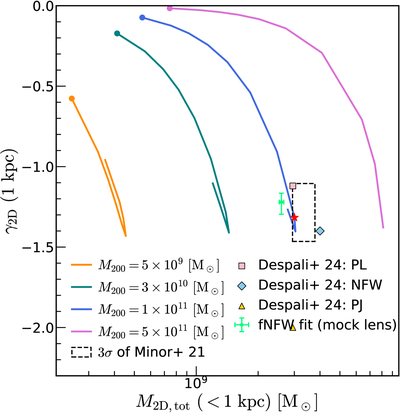
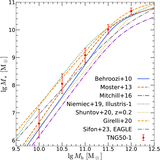
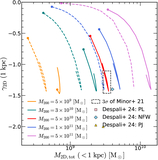
Caption: Figure 3.
Compare the results of constructed SIDM halos with J0946+1006 observations in the parameter space defined by γ2D (1 kpc) and M2D,tot ( < 1 kpc). The evolutionary trajectories of SIDM halos with different masses are represented by color-coded curves, where dots indicate the starting points of post-tmerge evolution. The black dashed square shows the 3σ measurement uncertainty of Q. Minor et al. (2021). For the SIDM halo with M200 = 1011 M⊙, a red star marks the moment when it most closely matches the results from Q. Minor et al. (2021). Fitting results for different models from G. Despali et al. (2025) are represented by markers of various shapes. Our tNFW fitting results derived from the mock lensing image are represented by a green point with 1σ error bars.
Other Images in This Article
Copyright and Terms & Conditions
© 2025. The Author(s). Published by the American Astronomical Society.