Image Details
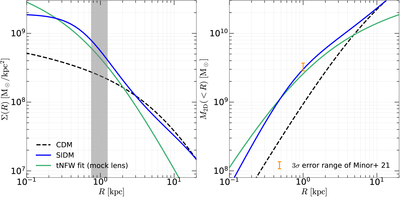
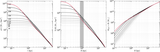
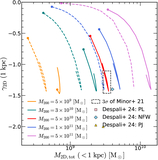
Caption: Figure 7.
Same format as Figure 2, but here we include the best-fit tNFW profile from our mock lensing image, with M200 = 2.40 × 10¹⁰ M⊙ and c200 = 62.25. Left: 2D projected surface density profiles, with the gray band indicating the radius range used to calculate the log slope, γ2D. Right: 2D enclosed mass profiles. The error bar indicates the 3σ measurement uncertainty of M2D,tot (<1 kpc) from Q. Minor et al. (2021).
Other Images in This Article
Copyright and Terms & Conditions
© 2025. The Author(s). Published by the American Astronomical Society.
Copyright ©
2026 Astronomy Image Explorer. All Rights Reserved.