Image Details
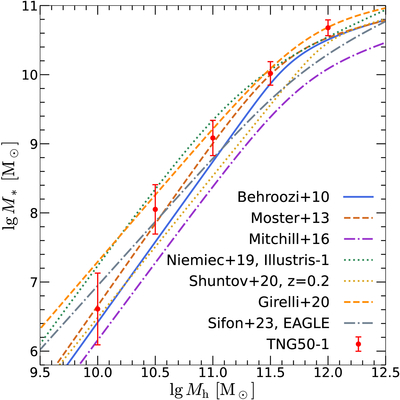
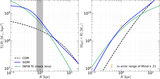
Caption: Figure 8.
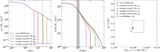
Median SHMRs from different studies. Colored curves show best-fit relations from P. S. Behroozi et al. (2010), B. P. Moster et al. (2013), P. D. Mitchell et al. (2016), A. Niemiec et al. (2019), G. Girelli et al. (2020), M. Shuntov et al. (2022), and C. Sifón & J. Han (2024), while the TNG-50 simulated result is marked by red dots with 1σ error bars.
Other Images in This Article
Copyright and Terms & Conditions
© 2025. The Author(s). Published by the American Astronomical Society.
Copyright ©
2026 Astronomy Image Explorer. All Rights Reserved.