Image Details
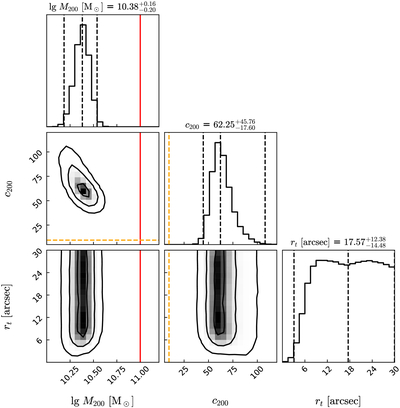
Caption: Figure 6.
The posterior distributions of M200, c200, and rt from the tNFW model fitting. In the 1D posteriors, the black dashed lines indicate the medians and the 3σ boundaries. In the 2D posterior, the black contours represent the 1σ, 2σ, and 3σ regions. The red line marks the M200 value of the input SIDM halo used to generate the mock image, while the orange dashed line corresponds to its c200 value.
Other Images in This Article
Copyright and Terms & Conditions
© 2025. The Author(s). Published by the American Astronomical Society.
Copyright ©
2026 Astronomy Image Explorer. All Rights Reserved.