Image Details
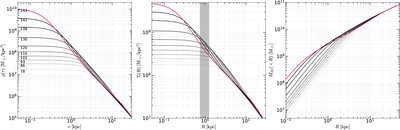
Caption: Figure 4.
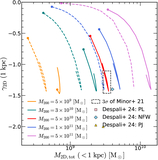
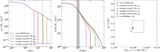
The evolution of the 3D density profiles (left panel), the 2D projected surface density profiles (middle panel), and the 2D enclosed mass profiles (right panel) during the post-tmerge stage for an SIDM halo with M200 = 1 × 10¹¹ M⊙. The black curves represent the density profiles prior to the turning point identified in Figure 3, with line darkness increasing to indicate temporal evolution. The red curve corresponds to the final snapshot after the turning point. In the left panel, the values of tage · σm (in units of 11.06 Gyr · cm2 g–1) are labeled below each line.
Other Images in This Article
Copyright and Terms & Conditions
© 2025. The Author(s). Published by the American Astronomical Society.
Copyright ©
2026 Astronomy Image Explorer. All Rights Reserved.