Image Details
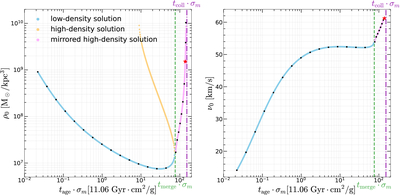
Caption: Figure 1.
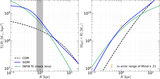
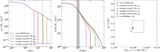
The temporal evolution of the central density ρ0 (left panel) and velocity dispersion ν0 (right panel) of an SIDM core with M200 = 1 × 10¹¹ M⊙. Considering the degeneracy between the formation time tage and the scattering cross section σm, we choose their product as the horizontal axis, with time measured in units of the cosmic time of J0946+1006 (11.06 Gyr). The blue, orange, and magenta scatter points represent the evolution for the low-density solution, high-density solution, and mirrored high-density solution, respectively. The moments corresponding to tmerge and tcoll are marked by a green dashed line and a purple dashed–dotted line, respectively. The black dots represent the moments we chose to examine the evolution of the SIDM profile, while the red star represents the moment closest to the result of Q. Minor et al. (2021) in the 2D observational space.
Other Images in This Article
Copyright and Terms & Conditions
© 2025. The Author(s). Published by the American Astronomical Society.