Image Details
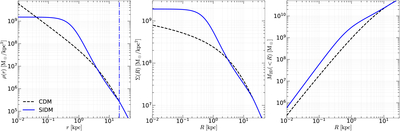
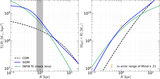
Caption: Figure 2.
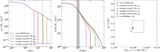
The density and mass profiles of a core-collapse SIDM halo with M200 = 1011 M⊙ (corresponding to the evolutionary stage indicated by the red star in Figure 1) and its CDM counterpart. SIDM and CDM profiles are shown in blue and black, respectively. Left: 3D density profiles, with the blue vertical dashed–dotted line marking the stitching radius, r1. Middle: 2D projected surface density profiles. Right: 2D enclosed mass profiles.
Other Images in This Article
Copyright and Terms & Conditions
© 2025. The Author(s). Published by the American Astronomical Society.
Copyright ©
2026 Astronomy Image Explorer. All Rights Reserved.