Image Details
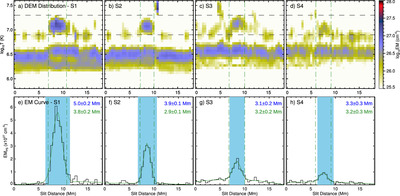
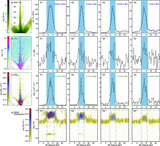
Caption: Figure 7.
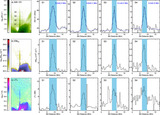
DEM distribution across the PS. Top panels show the DEM distributions from the sample locations (S1–S4) in Figure 6. The two horizontal dashed lines mark the temperature range of the PS (the same as those in Figures 5(a), (c)). Bottom panels show distributions of EMPS along S1–S4, i.e., the EM profiles summed over the DEMs between the two horizontal dashed lines in the top panels. The solid green curves in the bottom panels are the fitting results of the EMPS profiles, and the two vertical dotted–dashed lines in green mark the 2σ widths of the Gaussian fittings, with values and errors labeled in green. The two vertical green lines are also plotted on the DEM distributions in the top panels, which are consistent with the location of hot plasmas from the PS. The light blue shading and widths in blue in the bottom panels are taken from those in Figure 6 for comparison.
Other Images in This Article
Show More
Copyright and Terms & Conditions
© 2024. The Author(s). Published by the American Astronomical Society.