Image Details
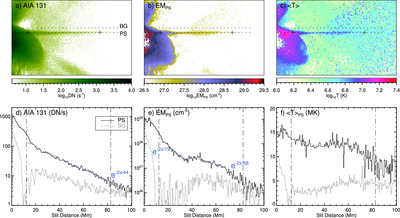
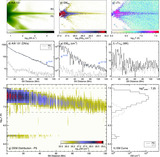
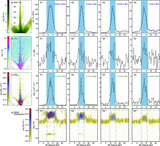
Caption: Figure 4.
Distribution of AIA intensity, EM, and temperature along the PS structure during the 2013 May 13 flare. Top panels show maps of AIA 131 Å, EMPS, and mean temperature 〈T〉. The two horizontal dotted lines indicate the sample locations (averaged over 3 pixels) for the curves plotted in the bottom panels, PS in black and BG (separated from PS by 6″) in gray, respectively. The blue dashed lines in panels (d), (e) show fitted results to the profiles using exponential functions ﹩\sim \exp (-2x/H)﹩, where H gives the scale height of emissions. The temperature curves in panel (f) are from the mean temperatures weighted by only the hot DEM component for the PS (〈T〉PS; black) and by the whole temperature range for the BG (〈T〉, the same as panel (c); gray), respectively. The two vertical dotted–dashed lines in the bottom panels mark the start and end of the observed PS (derived from Figure 5), which are also indicated by two plus symbols in the top panels.
Other Images in This Article
Show More
Copyright and Terms & Conditions
© 2024. The Author(s). Published by the American Astronomical Society.