Image Details
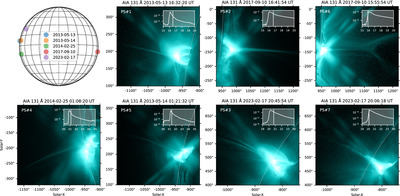
Caption: Figure 1.
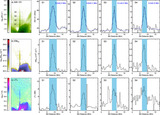
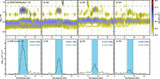
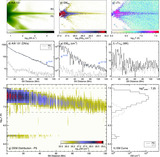
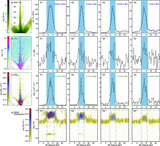
SDO/AIA observation of the solar flares and PS structures. The locations of flares on the Sun are indicated by colored circles in the top-left panel. The AIA 131 Å snapshots are composite images constructed from the combination of a pair of long- and short-exposure-time data. The dotted white curves in AIA images indicate the solar limb. The inserted plots in each map show the corresponding GOES 1–8 Å soft X-ray flux of the flare with a duration of 5 hr, where the vertical solid line marks the time of the AIA 131 Å map when the observed PS structure is selected for study.
Other Images in This Article
Show More
Copyright and Terms & Conditions
© 2024. The Author(s). Published by the American Astronomical Society.
Copyright ©
2026 Astronomy Image Explorer. All Rights Reserved.