Image Details
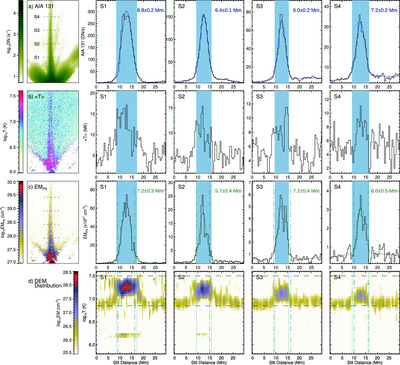
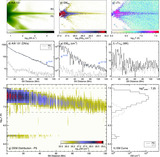
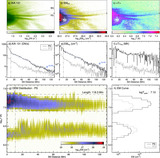
Caption: Figure 9.
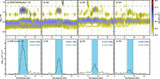
Distributions of the AIA intensity, mean temperature, EMPS, and the DEM across the PS. Same as Figures 6 and 7 but for PS#2. The four parallel slits (S1–S4) are separated by 33″ in this case. The fitted results to the AIA intensities and EMPS curves are plotted in blue and green, respectively. The vertical light blue lines in the bottom panels mark the edges of the light blue shading from fittings to the AIA 131 Å intensities. The vertical dotted–dashed green lines are from fittings to the EMPS profiles.
Other Images in This Article
Show More
Copyright and Terms & Conditions
© 2024. The Author(s). Published by the American Astronomical Society.
Copyright ©
2026 Astronomy Image Explorer. All Rights Reserved.