Image Details
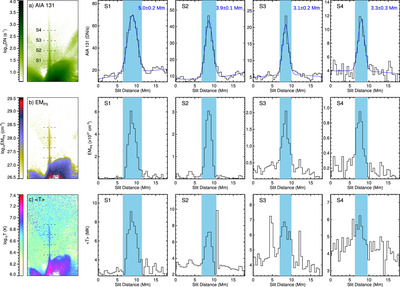
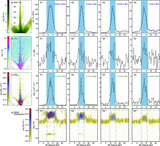
Caption: Figure 6.
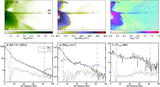
Distributions of the AIA intensity, EM, and temperature across the PS structure. Panels on the left show maps of AIA 131 Å, EMPS, and the mean temperature 〈T〉. The four dotted lines indicate sample locations (S1–S4; averaged over 3 pixels) to generate the curves plotted in the right four panels, respectively, which are parallel placed and separated from each other by 20″. The blue curves in the top panels are the fitting results of the AIA 131 Å intensities, and the light blue shading marks the 2σ widths of the Gaussian fittings. The width values and uncertainties of fits are labeled in blue at the top-right corner in each panel. The widths of the Gaussian fittings to the AIA intensities are also overplotted on the EMPS and temperature profiles in the middle and bottom panels for comparison.
Other Images in This Article
Show More
Copyright and Terms & Conditions
© 2024. The Author(s). Published by the American Astronomical Society.