Image Details

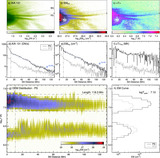
Caption: Figure 5.
DEM distribution along the PS during the 2013 May 13 flare. Panels (a), (c) show the DEM distributions from the PS and nearby background locations, indicated by the two parallel dotted lines in Figures 4(a)–(c), respectively. The two horizontal dashed lines mark the specific temperature range of the PS, and the two vertical dotted–dashed lines mark the start and end of the hot PS plasmas, which gives the length of the PS as labeled in panel (a). Panels (b), (d) show the curves of total EMs summed along the PS length, i.e., between the two vertical dotted–dashed lines in panels (a), (c), respectively. The peak temperature of the total EMs from the PS is labeled in panel (b). The EM curve from the BG in panel (d) is overplotted in panel (b) in gray for comparison.
Copyright and Terms & Conditions
© 2024. The Author(s). Published by the American Astronomical Society.


