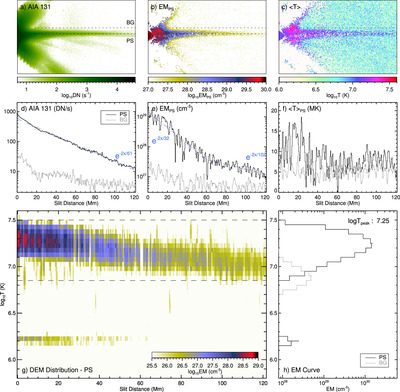
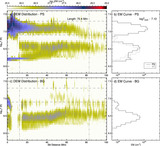
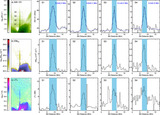
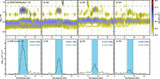
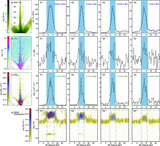
Distributions of AIA intensity, EMPS, mean temperature, and the DEM along the PS during the 2017 September 10 flare. Panels (a)–(f) are the same as Figure 4 but for PS#2, and panels (g), (h) are the same as Figures 5(a), (b). The location of the slit BG is separated from the PS by 10″ in this case.